Introduction
Manufacturing leaders recognize this pattern: a new Lean initiative launches with energy, the first 90 days deliver measurable gains—cycle times tighten, scrap drops, OEE climbs—and then performance quietly drifts back toward baseline.
The data confirms what experience already tells you. Research from the Lean Enterprise Institute shows that 60% of continuous improvement projects fail to sustain results, and only 10% maintained gains at the six-month mark before organizations implemented structured sustainment systems. McKinsey's 2021 survey of over 1,000 participants found that less than one-third of organizational transformations successfully improve performance and hold those gains over time.
The difference between organizations that sustain gains and those that revert comes down to behavior — not just process. This guide covers the proven strategies, critical KPIs, and behavioral science principles that explain why improvements last, and what to do when they don't.
Key Takeaways
- Most improvement efforts fail to sustain because they fix processes without changing behavior
- Proven methodologies only hold when paired with behavioral reinforcement that sustains change on the floor
- Track 3–5 KPIs—OEE, cycle time, first pass yield, scrap rate, on-time delivery—to stay grounded in real results
- Leadership behaviors—specifically consistent positive reinforcement—are the engine that sustains gains over time
- Lasting improvement is a culture, not a project—built by understanding what drives behavior on the plant floor
Why Manufacturing Improvement Initiatives Fail to Deliver Lasting Results
The "launch and fade" pattern follows a predictable arc. Improvement events generate excitement, cross-functional teams identify waste, new workflows get mapped, and early wins appear on dashboards. Then the consultant leaves.
Training materials collect dust. Daily pressures reassert themselves. Without structural changes to the behavioral environment, employees revert to previous habits—because those habits remain more comfortable, more familiar, and more reinforced by the existing workplace culture.
The failure rate is consistent across studies. McKinsey research reveals that 20% of total value loss occurs after implementation is complete—gains erode even after initiatives are fully executed. When frontline employees lack a sense of ownership, the success rate drops to single digits.
Common Operational Barriers:
- Old processes persist because reverting is easier than sustaining change under daily operational pressure
- Leaders respond only after problems escalate, inadvertently reinforcing firefighting over prevention
- No single owner of the new process means it fragments across functions until it quietly disappears
These barriers reinforce each other. When accountability is fragmented, no one drives the change through resistance—and reactive managers only surface problems after they've already eroded the gains.
The Tools-First Trap
Organizations invest heavily in Lean, Six Sigma, and Kaizen methodologies but treat them as events rather than ongoing systems. When the consultant departs and training sessions fade from memory, there is no reinforcement infrastructure to hold new behaviors in place.
Employees know what the new standard operating procedure is—they just receive no consistent feedback or recognition for following it. The antecedents (training, SOPs, visual management boards) are present, but the consequences—what happens to people after they perform the new behavior—are absent or even punitive.
The Cost of Standing Still
Small inefficiencies compound ruthlessly. Consider this framing: if a production line loses just 5 minutes per shift due to unnecessary motion waste, and that line runs three shifts per day across 250 working days, the result is 62.5 hours of lost production annually—per line. Multiply that across multiple lines, factor in labor rates and equipment costs, and the financial impact is significant.
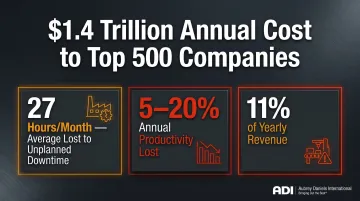
Global data from Siemens quantifies this reality: unplanned downtime costs the world's 500 largest companies $1.4 trillion annually, representing 11% of yearly revenues. The average large plant loses approximately 27 hours per month to unplanned downtime. The International Society of Automation estimates that the average plant loses 5% to 20% of annual productivity to unplanned downtime alone—not including the subtler, chronic inefficiencies that escape dashboards.
Core Thesis:
Lasting manufacturing improvement requires two simultaneous changes—a better process and a behavioral environment where the people executing that process are consistently reinforced for doing it correctly. Without both, improvement remains temporary.
Proven Strategies to Improve Manufacturing Performance
Lean Manufacturing and the Elimination of the 8 Wastes
Lean thinking systematically removes non-value-adding activities. The Lean Enterprise Institute identifies eight wastes: Defects, Overproduction, Waiting, Non-utilized talent, Transportation, Inventory, Motion, and Extra-processing (DOWNTIME acronym). The eighth waste—non-utilized talent—was added as Lean evolved beyond the factory floor, recognizing that failing to engage employee creativity and problem-solving capacity is itself a form of waste.
Mapping the value stream before implementing solutions is essential. Value stream mapping reveals where time and materials actually flow versus where they stall. This makes waste visible and builds shared understanding of the current state before teams redesign the future state.
Peer-reviewed research published in Materials Today: Proceedings documented a 5.4% productivity increase through line balancing and a 46% reduction in setup time using Single Minute Exchange of Dies (SMED) in a simulation-based Lean study.
Kaizen and Incremental Improvement Cycles
Kaizen's philosophy centers on small, employee-driven changes that compound over time. Structured Kaizen events create a repeatable vehicle for identifying and acting on shop-floor improvements, but Kaizen's power comes from worker empowerment, not just the event format. When frontline employees identify problems and lead solutions, engagement rises and improvements stick.
A published case study in the International Business & Economics Research Journal documented a Kaizen Blitz at a medical device manufacturing plant:
- 82% cycle time reduction (423 minutes to 73 minutes)
- 52% defect rate reduction
- 65% scrap cost reduction
- 27% labor reduction while maintaining output above 840 units/day
The Manufacturing Institute and American Psychological Association found that 97% of employees who feel valued are highly motivated, versus only 45% of those who do not—underscoring how empowerment drives discretionary effort.
Six Sigma and Data-Driven Quality
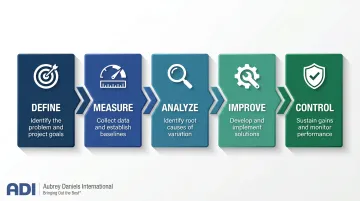
Six Sigma uses the DMAIC framework as a structured approach to reducing process variation and defects. According to the American Society for Quality, DMAIC covers five phases:
- Define the problem and customer requirements
- Measure current process performance with data
- Analyze root causes of variation and defects
- Improve the process by implementing targeted solutions
- Control gains by monitoring performance over time
Statistical process control connects that ongoing data to actionable decisions, enabling teams to catch variation before it escalates into defects. The financial results are documented at scale: Motorola attributed more than $16 billion in savings to Six Sigma, and General Electric reported approximately $12 billion over five years.
5S Methodology and Standardized Work
The 5S steps—Sort, Set in Order, Shine, Standardize, Sustain—create the foundation that makes all other improvement activities possible. ASQ defines 5S as resulting in "a workspace that is clean, uncluttered, safe, and well-organized, which can help reduce waste and optimize productivity."
A disciplined, visual workplace reduces variation and makes deviations from standards immediately visible. Research published in Materials Today: Proceedings found that 5S implementation increased productivity to 68% at a pump manufacturing facility, with significant reductions in time consumption and waste. Of the five steps, Standardize had the greatest measured impact on productivity, followed by Shine and Sustain.
Technology as Amplifier, Not Driver
5S and standardized work create the stable foundation that technology can build on. OEE monitoring tools, IoT sensors, and ERP integrations provide real-time data that accelerates improvement decisions. But technology delivers value only when the people using it have clear expectations, training, and consistent reinforcement for acting on what the data shows. Without those behavioral conditions in place, even the best monitoring systems go ignored.
Key KPIs and Metrics for Measuring Manufacturing Performance
The Core Manufacturing KPIs
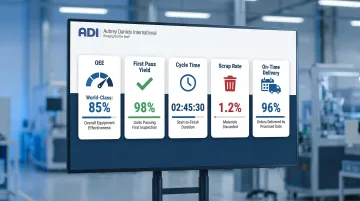
Every performance improvement program should track:
- Overall Equipment Effectiveness (OEE) — Availability × Performance × Quality. World-class OEE is 85%; 60% is fairly typical; 40% is common for companies just starting to track it. OEE captures losses from unplanned stops, slow cycles, and defects.
- First Pass Yield (FPY) — Percentage of units passing quality inspection the first time without rework. Higher FPY means less waste and lower cost per unit.
- Cycle Time — Total time from beginning to end of a process. Shorter cycle times mean faster throughput and greater responsiveness.
- Scrap Rate — Percentage of materials or units discarded as waste. Lower scrap directly improves material utilization and margin.
- On-Time Delivery (OTD) — Percentage of orders delivered by the promised date. OTD links manufacturing performance to customer satisfaction and revenue.
Avoid Metric Overload
Tracking too many KPIs dilutes focus and accountability. Select 3–5 metrics that align directly with your improvement goals, make them visible on the plant floor, and review them in structured team cadences. When leaders track 20 metrics, none get the attention needed to move the needle.
Connect Metrics to Behavior
Selecting fewer metrics only works if people actually connect to them. That requires three conditions:
- Comprehension — workers understand what the number measures and how their actions affect it
- Data trust — teams believe the numbers are accurate and fairly collected
- Consistent feedback — leaders close the loop regularly, not just at month-end reviews
Without these, dashboards become wallpaper. A daily huddle that reviews OEE and calls out the team that improved availability by 3% last week creates a real behavioral loop. A monthly report emailed to managers does not.
The Behavior Science Missing From Most Manufacturing Improvement Programs
The ABC Model and Why It Matters
Every improvement methodology ultimately depends on changing what people do, yet most programs focus almost entirely on process redesign while ignoring the science of why people change—and sustain—new behaviors. Applied Behavior Analysis (ABA) offers the missing framework.
The antecedent-behavior-consequence (ABC) model works like this:
- Antecedents set the stage for behavior (training, SOPs, new equipment, visual cues)
- Behavior is what the person does
- Consequences are what happens to the person after they perform the behavior
Antecedents are necessary but insufficient on their own. Consequences—what happens after a behavior—determine whether that behavior repeats or extinguishes. Most improvement programs over-invest in antecedents (more training, clearer instructions) and under-invest in consequences (recognition, feedback, reinforcement).
Discretionary Effort and Why It Matters
There is a gap between the minimum performance an employee will accept (just enough to keep the job) and the maximum they are capable of delivering. Positive reinforcement is the mechanism that closes this gap and drives the extra engagement that makes improvement initiatives succeed.
Research from Zenger Folkman involving over 18,000 direct reports found that leadership practices—not compensation—serve as the primary catalyst for discretionary effort. While 76% of leaders excel at "pushing" (driving for results and compliance), only 22% excel at "pulling" (inspiring discretionary effort through engagement and recognition).
ADI's Behavior-Based Performance Management Methodology
Aubrey Daniels International has applied behavioral science to manufacturing and other industries for over 45 years. ADI's Performance Management methodology gives organizations a structured way to identify the specific behaviors that drive results, measure them consistently, and build supervisor coaching systems that reinforce those behaviors in real time—turning one-time improvement projects into durable operational habits.
The Practical Difference
Contrast two plants implementing the same Lean methodology:
| Plant A | Plant B | |
|---|---|---|
| Process changes | Redesigned workflow, updated SOPs, new visual boards | Same redesigned workflow and SOPs |
| Reinforcement system | None — project declared complete at launch | Daily supervisor observations, specific positive feedback, weekly win reviews |
| 12-month result | Performance regressed to within 10% of baseline | Gains held and expanded |
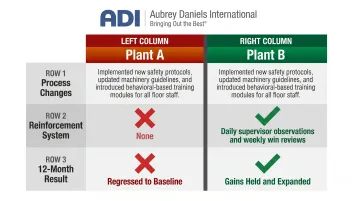
The difference isn't the Lean tools. It's whether new behaviors are more reinforced than old ones. Plant B's supervisors didn't just train operators — they made following the new standard the path of least resistance by consistently recognizing it.
Building Leadership Habits That Sustain Manufacturing Performance Gains
The Behaviors That Sustain Versus Kill Momentum
Leadership habits—not project milestones—determine whether performance gains hold. Providing specific, timely positive feedback when employees follow new processes correctly is what sustains behavior over time. When a supervisor observes an operator executing the new changeover sequence properly and immediately acknowledges it ("I noticed you completed that setup in 12 minutes following the new SMED process. That's a significant improvement"), the operator is more likely to repeat the behavior.
Only responding to failures and errors creates a punitive environment where employees do the minimum required and disengage from improvement efforts. When the only time a supervisor speaks to an operator is to point out a mistake, the operator learns that visibility equals punishment—and begins to avoid visibility.
McKinsey found that transformations are 12.4 times more likely to succeed when senior managers communicate continually about the transformation, and 5.3 times more likely when leaders role-model the behavior changes they ask of employees.
ADI's Precision Leadership Approach
ADI's Precision Leadership approach equips manufacturing leaders with practical, behavior-based coaching tools that build the daily habits needed to maintain employee performance at scale. Rather than relying on annual performance reviews or sporadic recognition, Precision Leadership embeds feedback and reinforcement into the daily rhythm of plant-floor leadership.
Core tools include:
- Structured behavioral observation to catch and reinforce correct execution in real time
- Data-driven feedback that connects individual actions to measurable outcomes
- Positive reinforcement techniques that make following new standards visible and valued
- Coaching frameworks designed for frontline supervisors, not just senior managers
The Business Case for Leadership Development
When frontline supervisors and managers consistently reinforce the right behaviors, the organization no longer depends on external consultants or periodic "refresh" events to maintain improvement gains. Leaders who master behavioral coaching create environments where employees follow new standards because doing so is recognized and valued—not because compliance is monitored. That shift is what separates organizations that sustain gains from those that backslide within a year.
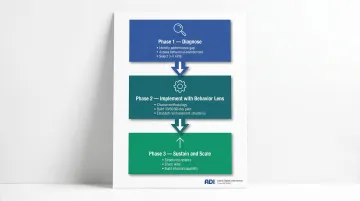
Your Step-by-Step Roadmap for Lasting Manufacturing Improvement
Most manufacturing improvement efforts stall not because the methodology was wrong, but because the behavioral side was ignored. This three-phase roadmap addresses both.
Phase 1 — Diagnose
Identify a specific, high-impact performance gap:
- One production line with chronic downtime
- One recurring defect category driving rework costs
- One costly bottleneck limiting throughput
Assess both process conditions and the behavioral environment:
- Are operators trained on the correct process?
- Are the right behaviors being reinforced or inadvertently punished?
- Do supervisors provide feedback, or only intervene when problems escalate?
Select 3–5 KPIs to define success:
- Choose metrics tied directly to the identified gap (e.g., OEE, scrap rate, cycle time)
- Make baseline performance visible
- Set a specific improvement target with a deadline
Phase 2 — Implement with a Behavior Lens
Choose the improvement methodology that fits the gap:
- Lean for waste elimination
- Six Sigma for variation and quality
- 5S for organization and visual management
- Kaizen for employee-driven rapid improvement
- Combine methods when the gap has multiple root causes
Set a 30/60/90-day plan with visible tracking:
- Post metrics daily where the team works
- Conduct brief huddles to review progress
- Celebrate small wins immediately
Build reinforcement and feedback structures from day one:
- Train supervisors to observe and recognize target behaviors
- Establish a regular cadence for positive feedback, not just corrective action
- Make following new standards more rewarding than falling back on old habits
Phase 3 — Sustain and Scale
Conduct regular structured reviews:
- Weekly team huddles to review KPIs and surface obstacles
- Monthly leadership reviews to identify patterns and remove systemic barriers
- Quarterly assessments to determine whether gains are holding or slipping
Document and share wins across the organization:
- Publish success stories internally
- Recognize teams and individuals publicly
- Show teams that positive reinforcement drives measurable results
Invest in building internal capability:
- Develop internal coaches and facilitators
- Certify leaders in behavioral coaching and performance management
- Embed improvement practices into daily routines so they outlast any single initiative or outside consultant
Frequently Asked Questions
How can manufacturing be improved?
Manufacturing improves through proven process methodologies (Lean, Kaizen, Six Sigma), disciplined KPI measurement, and a behavioral reinforcement system that ensures new practices are executed consistently and sustained over time.
What are the 5 KPIs for manufacturing?
The five most widely cited manufacturing KPIs are Overall Equipment Effectiveness (OEE), First Pass Yield, Cycle Time, Scrap Rate, and On-Time Delivery. The most meaningful set for any organization depends on its specific improvement goals and operational priorities.
What are the 5 M's of manufacturing?
The 5 M's—Man, Machine, Material, Method, and Measurement—are the core elements used to diagnose performance gaps, often through a fishbone diagram. Addressing the "Man" component through behavioral science is what separates temporary fixes from lasting improvement.
Why do manufacturing improvement programs fail to produce lasting results?
Most programs focus on redesigning processes and installing new tools but neglect to change the behavioral environment. Without reinforcing new behaviors, employees revert to old habits and gains erode — often within six months of implementation.
How does employee behavior affect manufacturing performance?
Employee behavior determines whether process improvements are executed consistently day after day. Positive reinforcement and clear feedback loops are what drive discretionary effort and sustain higher performance — shifting employees from doing the minimum to genuinely owning results.