The problem isn't measuring engagement — it's what gets measured. When assessment programs focus on how employees feel on a given Tuesday rather than whether they're choosing to give their best effort, the data looks fine while the underlying conditions stay broken.
Gallup's 2026 global data puts the cost of low engagement at an estimated $10 trillion in lost productivity — roughly 9% of global GDP. Yet only 20% of employees worldwide report being engaged at work.
This guide covers what engagement assessment actually needs to measure, what to do before the first survey goes out, which methods work and why, how to interpret results without being misled by averages, and the mistakes that make all of it irrelevant.
Key Takeaways
- Engagement measures behavioral investment and discretionary effort , not contentment or satisfaction
- Define specific business questions and assign clear ownership before any survey is designed
- Combine structured surveys, manager conversations, and behavioral observation; no single method is sufficient
- Aggregate scores mislead; always segment by team, tenure, role, and manager
- Assessment without visible follow-through actively damages trust and kills future participation
What Employee Engagement Assessment Really Measures
Most organizations conflate engagement with satisfaction — and that confusion leads directly to programs that move survey scores without moving performance.
Satisfaction measures how content employees feel about their working conditions. Engagement — as Macey and Schneider established in 2008 — implies activation. It measures how much employees choose to invest of themselves, beyond what's minimally required. High satisfaction without high engagement is entirely possible: employees who like their jobs, appreciate the perks, and still do the bare minimum.
Discretionary Effort as the Real Signal
The most practical proxy for engagement is discretionary effort — the gap between what employees are required to do and what they willingly choose to do.
ADI (Aubrey Daniels International), which has applied behavioral science to organizational performance for over 45 years, defines discretionary effort as "the level of effort people could give if they wanted to, but above and beyond the minimum required." An engaged employee isn't someone who scored 4 out of 5 on a satisfaction item. They're someone who:
- Volunteers to solve a problem before being asked
- Stays to help a teammate through a difficult task
- Raises a concern before it becomes a crisis
Assessment programs that capture only attitudes miss these behavioral signals entirely — which is why what an instrument actually measures matters as much as how often it's administered.
What Validated Engagement Models Actually Assess
Most well-designed engagement instruments measure across three connected dimensions:
- Connection to work — motivation, sense of purpose, inspiration in day-to-day tasks
- Connection to team — belonging, collaborative behavior, commitment to shared outcomes
- Connection to the organization — advocacy, pride in the brand, intent to stay
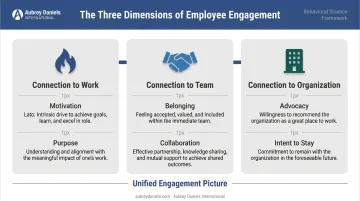
When all three are measured together, the picture of engagement becomes diagnostic rather than decorative. Programs that measure only one — typically satisfaction with compensation or management — produce a distorted picture. Programs built around boosting happiness scores — events, perks, free lunch — can temporarily lift survey numbers without changing the reinforcement conditions that actually drive behavioral investment.
What You Need Before You Start Assessing Employee Engagement
The most common reason engagement assessment fails isn't a bad survey instrument. It's that organizations launch the survey without defining what they're trying to learn.
Start with 3–5 specific, decision-oriented business questions before designing any measurement approach. These aren't vague goals — they're questions that actually change what you measure:
- "Why is voluntary turnover higher in our manufacturing division than anywhere else in the company?"
- "Do frontline employees understand the protocol changes we communicated last quarter?"
- "Which teams are showing early warning signs that our recent restructuring is creating clarity problems?"
Without these questions, survey design defaults to a generic template and results default to a company-wide score that tells no one what to do.
Preconditions and Setup
Ownership and accountability: Before a single survey goes out, name who receives the results, who is responsible for acting on findings at each level (executive, HR, manager), and what "action" specifically looks like.
Gallup research found that only 8% of employees strongly agree their organization takes action on engagement surveys. When organizations survey without acting, engagement and retention both decline. Data collection without a named owner is performative.
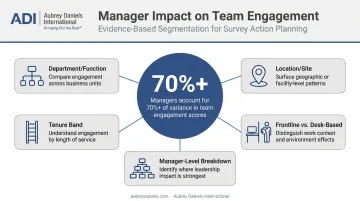
Baseline segments: Decide in advance which breakdowns of the data will actually be useful. Standard segments include:
- Department and function
- Location and site
- Tenure band (under 1 year, 1–3 years, 3+ years)
- Frontline vs. desk-based employees
- Manager-level breakdown
Manager-level segmentation is where the data gets actionable. Gallup data consistently shows that managers account for at least 70% of the variance in team-level engagement scores. No company-wide average tells you what a manager-level slice will.
Methods to Assess Employee Engagement in the Workplace
No single method gives you the full picture. Organizations that assess engagement most accurately combine structured survey instruments, ongoing qualitative conversations, and direct behavioral observation — each operating at a different cadence and capturing different signals.
Structured Surveys: Annual and Pulse
Annual surveys provide the foundation — typically 30–50 questions covering all major engagement drivers, sent company-wide once a year to establish a consistent benchmark. Their strength is depth and comparability over time. Their limitation is obvious: a once-a-year snapshot misses teams that deteriorate in the months between cycles.
Pulse surveys fill that gap. Three to seven focused questions sent monthly, quarterly, or immediately after a significant organizational event (a restructuring, a leadership change, a major policy update). Event-based pulses are particularly effective because employees find them relevant — the timing signals clear intent, and response rates tend to follow.
ADI's Pulse Checks are designed specifically for this purpose: brief 6–8 question instruments that let organizations quickly gauge where to focus energy on a specific initiative or following a change.
Manager Conversations and Stay/Exit Interviews
Structured 1:1 conversations — regular check-ins, stay interviews, and lifecycle conversations at onboarding or role transitions — surface qualitative depth that surveys can't replicate. A manager who asks the right questions can identify a retention risk in 20 minutes that a quarterly pulse survey would take two cycles to surface.
This method only works if managers have behavioral coaching skills, not just access to survey results. ADI's Applications of Behavioral Leadership and Behavioral Leadership Training programs are specifically designed to build this capability — teaching managers to observe behavior, interpret what's driving it, and have direct conversations that improve performance rather than just document it.
Exit interviews are a lagging indicator, but they carry forward-looking value when analyzed correctly. Patterns across cohorts, compared against engagement data from the same period, can reveal precisely where reinforcement systems are breaking down and which teams or managers are at the center of the problem.
Behavioral and Operational Indicators
Observable behaviors and operational metrics offer engagement signals that don't depend on self-reporting:
- Voluntary turnover rate — especially among high performers
- Unplanned absenteeism — a consistent early warning signal for disengagement
- Safety incident frequency — particularly relevant in manufacturing and industrial settings
- Internal communication engagement — open rates, response rates, participation in feedback channels
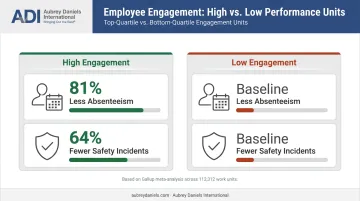
Gallup's meta-analysis across 112,312 work units found that top-quartile engagement units showed 81% less absenteeism and 64% fewer safety incidents than bottom-quartile units. Those figures confirm that operational data tracks engagement closely — making it a reliable signal when survey data is unavailable or incomplete.
ADI has documented this pattern directly in client work. A natural gas producer managing 700+ wells saw observable safe behavior rise from 50% to 75% within weeks of implementing behavioral engagement interventions — with sustained reductions in contractor turnover following shortly after.
Direct behavioral observation is the other piece. Managers trained to systematically notice discretionary effort — who volunteers, who helps a colleague through a problem, who raises concerns proactively — are running ongoing engagement assessment without a formal instrument.
ADI trains leaders in this capability through the PIC/NIC Analysis® framework and its 4-day Applications of Behavioral Leadership workshop, so managers can identify and reinforce the specific behaviors that signal genuine engagement.
How to Interpret Your Engagement Assessment Results
Aggregate scores are the least useful output from any engagement assessment. A company-wide favorable score of 72% can mask a single team sitting at 41% — and that team at 41% is where turnover is about to spike.
Running a Gap Analysis
Slice every result by every meaningful segment you defined before the survey launched. Flag any group sitting meaningfully below the organization average. Those gaps — not the company-wide number — are where assessment becomes actionable.
What normal results look like:
- Scores consistent across segments without significant outliers
- Strong driver scores for clarity of expectations, recognition, and manager support
- Response rates that indicate employees believe the process matters
When results look like this, the right move is to maintain cadence, share results transparently, and name what's working. Don't over-engineer what isn't broken.
Reading the Warning Signs
Early warning signals often appear at the driver level before they show up in overall scores:
- Declining scores on manager support or clarity of direction in one segment while company-wide scores remain stable
- Falling response rates — which signal that employees no longer believe the data leads anywhere
- Rising unplanned absenteeism in a team that scored well six months ago
These patterns call for targeted follow-up (a focused manager conversation, a segment-specific communication), not a company-wide initiative.
When Results Are Critically Low
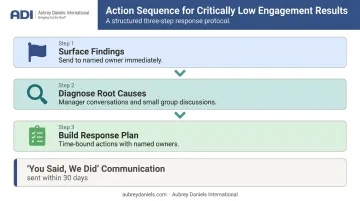
Warning signs become crisis indicators when the behavioral data catches up. By the time engagement is severely low, turnover is rising, absenteeism is elevated, and quality or safety incidents are increasing. The action sequence is:
- Surface findings to the named owner immediately
- Diagnose root causes through qualitative follow-up (manager conversations, small group discussions)
- Build a time-bound response plan with named actions
The most important step after any survey is the "you said, we did" communication, sent within 30 days of survey close. It names the specific actions tied directly to what employees flagged. When employees see their input reflected in real decisions, they're more likely to participate honestly in the next cycle — and that participation is what makes the data meaningful over time.
Common Mistakes When Assessing Employee Engagement
Over-relying on a single method. Annual surveys miss real-time signals. Pulse surveys alone lack the depth to diagnose root causes. Relying exclusively on either produces a partial picture that leads to partial — or wrong — responses.
Treating aggregate scores as the story. A favorable average that masks a struggling segment is more dangerous than an honest low score. It gives leadership false confidence that no targeted action is needed, while the problem continues to compound.
Surveying without a follow-up plan. When employees complete surveys and see no visible response, the next survey's participation rate drops. The one after that drops further. A survey without follow-through doesn't just waste the data — it actively teaches employees their input doesn't matter.
Gallup reports that only 8% of employees strongly agree their organization acts on survey results — a figure that reflects how common this failure is, not how acceptable it is.
Mistaking satisfaction for engagement. Beyond process failures, there's a measurement trap worth naming. Programs that optimize for happiness scores — perks, social events, free lunch — can produce high satisfaction results alongside low discretionary effort. The behavioral indicators will tell the truth even when the survey scores look fine.
Best Practices for Sustainable Engagement Assessment
Build a Layered Cadence
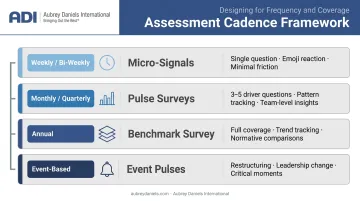
Match assessment frequency to your organizational rhythm, not your survey vendor's contract cycle:
- Weekly or bi-weekly micro-signals : a single embedded question, an emoji reaction in a team communication
- Monthly or quarterly pulse surveys : 3–5 questions on priority drivers
- Annual benchmark : full coverage for trend tracking and cross-segment comparison
- Event-based pulses : deployed after restructuring, leadership transitions, or major policy changes
Close the Loop Visibly
Share results at the same level of transparency used to collect them. Name the specific actions tied to what employees flagged. Then measure whether those actions moved the relevant driver scores in the next assessment cycle.
Gallup research shows that employees who receive meaningful feedback regularly are significantly more engaged — and the performance gap between annual-only feedback and ongoing feedback is substantial.
ADI's surveys and assessments practice is built around this feedback loop: results translate directly into coaching action plans for people, systems, and processes so that behavior change follows data collection rather than waiting on it.
Build Manager Capability Into the System
The best assessment programs don't just give managers data — they equip managers to use it. Presenting team-level results in a format that prompts action rather than defensiveness, and giving managers the coaching skills to turn numbers into conversations.
ADI segments data so each leader sees only results relevant to their area, with surveys designed to move directly from insight to targeted behavioral change at the team level.
Frequently Asked Questions
What is the best way to measure employee engagement?
The strongest approach combines structured surveys (annual for benchmarking, pulse for real-time signals) with qualitative methods like manager 1:1s and stay interviews, plus behavioral and operational indicators. No single method captures the full picture. Reliable assessment depends on using multiple methods together.
How often should you assess employee engagement?
A layered cadence works best: weekly or bi-weekly micro-signals at the team level, monthly or quarterly pulse surveys on key drivers, and an annual comprehensive benchmark. Add event-triggered pulses after major changes like restructuring or leadership transitions.
What are the key behavioral indicators of employee disengagement?
Watch for rising unplanned absenteeism, declining voluntary participation in team activities, reduced initiative and discretionary effort, falling response rates on internal communications, and increasing voluntary turnover — particularly among high performers who have the most options.
What is the difference between employee engagement and employee satisfaction?
Satisfaction reflects how content employees feel about their working conditions. Engagement reflects the behavioral investment and discretionary effort they choose to bring to their work. High satisfaction does not guarantee high engagement — employees can be comfortable and still give the minimum.
How do you assess employee engagement without relying solely on surveys?
Manager 1:1s and stay interviews surface qualitative depth quickly. Direct behavioral observation — who demonstrates discretionary effort, who raises concerns proactively — provides ongoing signals without a formal survey. Operational metrics like turnover, absenteeism, and productivity complete the picture.
What should managers do after assessing employee engagement?
Share results with the team, name the specific actions being taken in response, and track whether those actions improved engagement scores in the next cycle. Visible follow-through is what makes the next assessment worth completing.